ijitrack.com : Monitoring and management in real-time of your data
Web Interface to supervise all your data, manage your clients accounts, export data in detailed reports

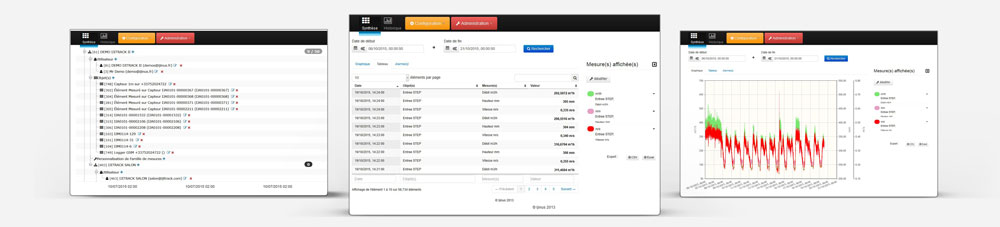
Simple and intuitive interface
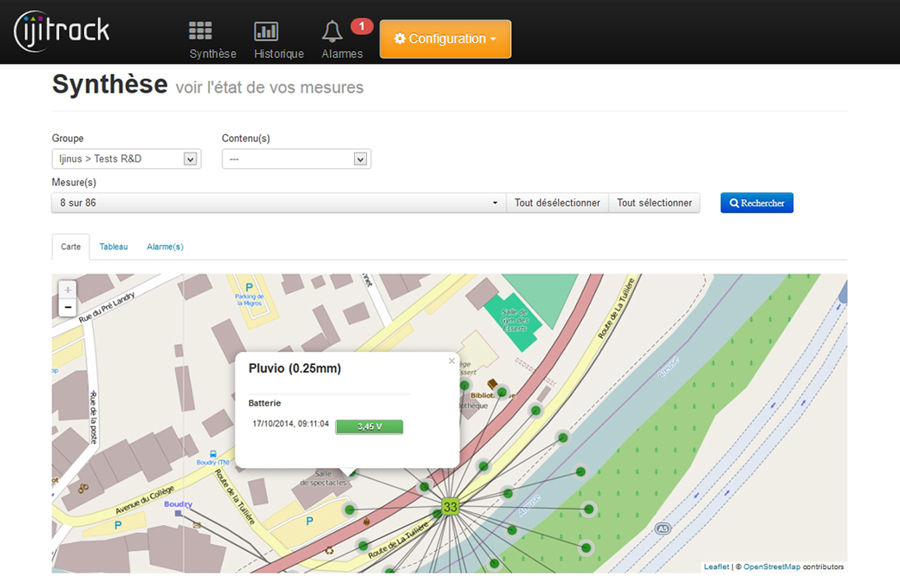
3 sections allow you to manage your data :
Summary, History and Alarm. These data are visible on map, table and object
Devices configuration
The configuration wizard allows you to quickly add new sensors by selecting the account, the name, containing model
Export
Customizable exports to CSV and Excel sensor,
by group, from date to date. Automated HTTP request export available
Protected Data Access
HTTPS secure connection
128-bit encryption
Accounts management
Supervise all your sensors, manage your own client accounts and different site locations through a tree structure style
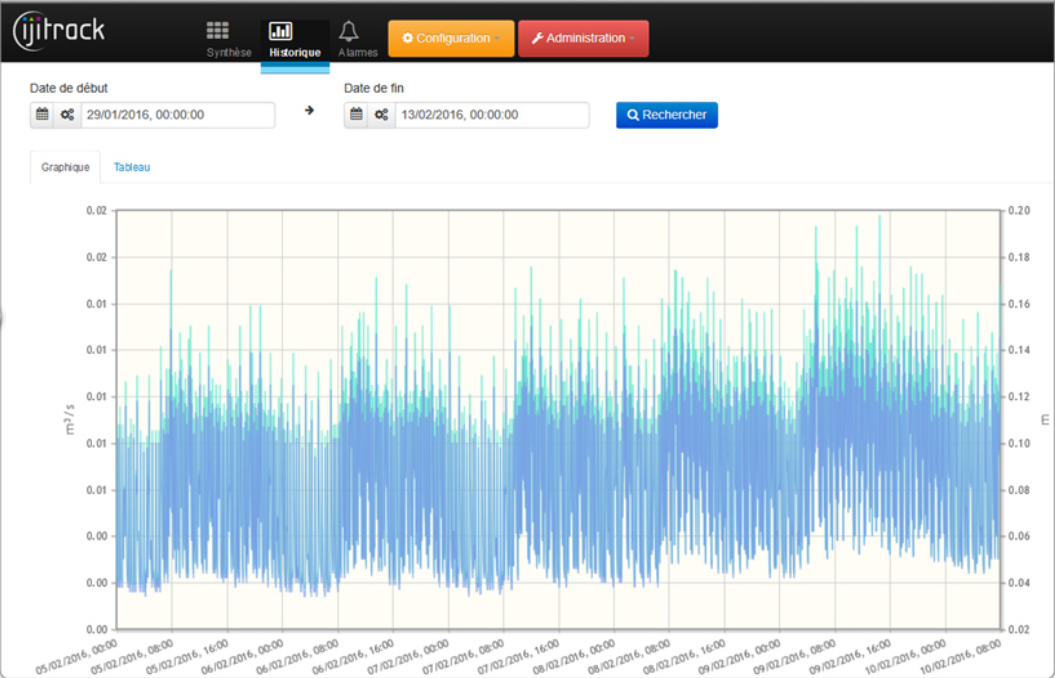
Multi-axis and multi-curves graphs
The interface allows you to compare your data,
from different sensors
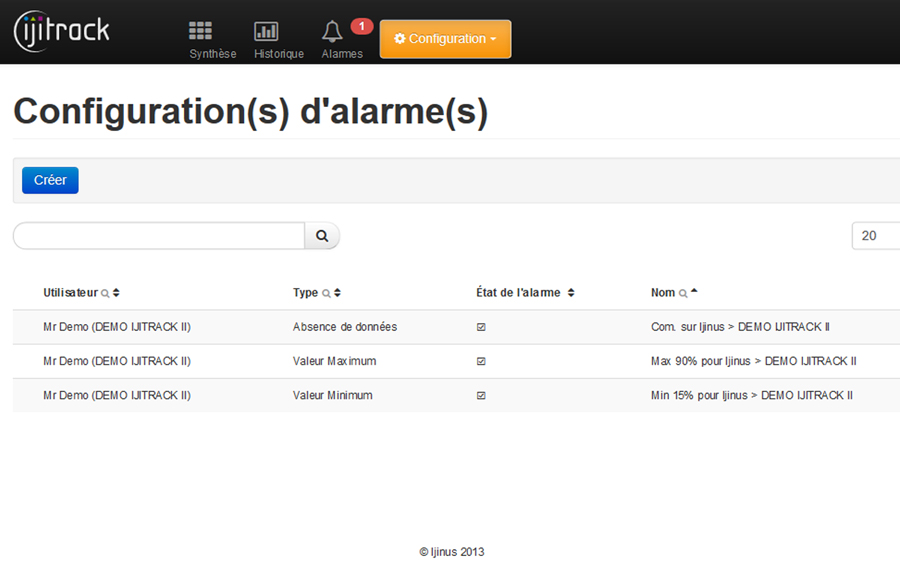
Fonctionnalities :
Ijitrack allows you to generate alarms on level, overflow, flow rate and all other parameters from our sensors. For each alarm you can set a high threshold and a low threshold. Alarms are visible on ijitrack.com and can be transmitted by E.mail, SMS to your mobile.
- Centralization and timestamp of data, displayed in summary and history pages
- Simplified creation and management of customer accounts, visible by groups in tree view
- Import data by SMS, GPRS (FTP), 3G, Sigfox
- User rôle management : administrator, éditor, viewer, group
- Automatic alarms sending via Email, SMS (up to 20 recipients)
- Data export in Xls and Csv files
- Export automatizable by HTTP requests
- Graphical display of data : Multi-axis graph – up to 7 curves – alarm thresholds
(Each user can set his own alarm thresholds)
Web Platform Demo Version :
An evaluation version is available to test Ijitrack features. This one includes different modules like Summary, History and Alarms. The full version includes more modules (Configuration and Administration). Do not hesitate to contact us to also test them.
Demo site : ijitrack.com
User name : demo@ijinus.fr
Password : secret